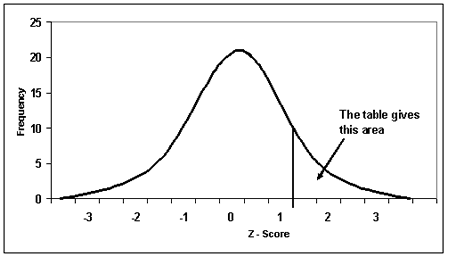
The outliers in a data set can bias the mean and inflate the standard deviation. Screening data is an important way to detect them. Generally speaking, there are two ways to detect outliers: 1) graph the data with a histogram 2) look at z-score.
A z-score indicates how many standard deviations an element is from the mean. A z-score can be calculated from the following formula:
z = (X – μ) / σ
where z is the z-score, X is the value of the element, μ is the population mean, and σ is the standard deviation.
The following are some examples of interpreting z-score:
- A z-score less than 0 represents an element less than the mean.
- A z-score greater than 0 represents an element greater than the mean.
- A z-score equal to 0 represents an element equal to the mean.
- A z-score equal to 1 represents an element that is 1 standard deviation greater than the mean; a z-score equal to 2, 2 standard deviations greater than the mean; etc.
- A z-score equal to -1 represents an element that is 1 standard deviation less than the mean; a z-score equal to -2, 2 standard deviations less than the mean; etc.
- If the number of elements in the set is large, about 68% of the elements have a z-score between -1 and 1; about 95% have a z-score between -2 and 2; and about 99% have a z-score between -3 and 3.
The assumption of calculation of z score is that the frequency distribution of the data is normally distributed. We can find out the probability of a score occurring by standardising the scores, known as z scores.

If the probability of a score occurring is too small, then it has a high possibility to be an outlier.
The following code can be used to detect outliers by looking at z-score:
outlierSummary<-function(variable, digits = 2){

	zvariable<-(variable-mean(variable, na.rm = TRUE))/sd(variable, na.rm = TRUE)

	outlier95= 1.96
	outlier99= 2.58
	outlier999= 3.29

	ncases<-length(na.omit(zvariable))

	percent95<-round(100*length(subset(outlier95, outlier95 == TRUE))/ncases, digits)
	percent99<-round(100*length(subset(outlier99, outlier99 == TRUE))/ncases, digits)
	percent999<-round(100*length(subset(outlier999, outlier999 == TRUE))/ncases, digits)

	cat("Absolute z-score greater than 1.96 = ", percent95, "%", "\n")
	cat("Absolute z-score greater than 2.58 = ",  percent99, "%", "\n")
	cat("Absolute z-score greater than 3.29 = ",  percent999, "%", "\n")
}
Thanks on your marvelous posting! I seriously enjoyed reading it, you may be a great author.I will make sure to bookmark your blog and definitely will come back later in life. I want to encourage you to ultimately continue your great writing, have a nice afternoon!